

Value Picks
Attractive PS ratios combined with strong financial metrics: Value Picks.
Screener Overview
Screener purpose
The Value Picks screener is designed to spotlight stocks with compelling valuation metrics, focusing particularly on the Price to Sales (PS) ratio. This screener helps investors find companies that are not only financially robust but also attractively valued, offering a blend of quality and value.
The Value Picks screener carefully selects stocks with solid financial health and profitability, emphasizing those with a low PS ratio to ensure they are attractively priced. By filtering for high return on equity (ROE) and return on invested capital (ROIC) over both 5 and 10-year periods, this screener highlights companies with consistent performance. Additionally, it excludes OTC stocks, preferred stocks, and companies with multiple classes in one region, maintaining a focus on straightforward, high-quality equity investments. Metrics like the Piotroski F-Score and years of profitability and positive free cash flow over the past decade further refine the selection process to identify stable, well-valued companies.
Main feature
The standout feature of the Value Picks screener is its focus on the PS ratio (Price to Sales), providing a crucial metric for evaluating the relative valuation of stocks. By prioritizing companies with low PS ratios, this screener ensures that selected stocks are attractively priced relative to their sales, enhancing the value investing approach.
Investment Style
The Value Picks screener aligns with a "Value Investing" style, placing significant emphasis on attractive valuation metrics, particularly the PS ratio. It balances this with quality criteria to ensure the selected stocks are financially robust and well-positioned for long-term performance.
Performance
- Screener - Global Performance: 406.06%
- S&P500 - Global Performance: 140.06%
Screener Attributes
-
Filters
- PS (Price-to-Sell) Ratio <= 1
- PE Ratio (TTM) <= 15
- Piotroski F-Score >= 7
- Above 20-Day SMA
- ROE % (5y Median) >= 10
- ROE % (10y Median) : Positive
- ROC (ROIC) (5y Median) >= 10
- ROC (ROIC) (10y Median) : Positive
- Years of Profitability over Past 10-Year >= 7
- Years of Positive FCF over Past 10-Year >= 7
-
Backtest Filters
- Ranked by PS Ratio (Ascending)
- Max. of 5 stocks selected
- Rebalanced every year
- Equally weighted every year
Screener Selection
-
2024
Log in or Upgrade to access the 2024
stock selection -
2023
- DINO - HF Sinclair Corp
- CVI - CVR Energy Inc
- IIIN - Insteel Industries Inc
- EC - Ecopetrol SA
- KFRC - Kforce Inc
-
2022
- No stock matching filters
-
2021
- MUSA - Murphy USA Inc
- APOG - Apogee Enterprises Inc
- ENVA - Enova International Inc
- HUM - Humana Inc
-
2020
- TUP - Tupperware Brands Corp
- MLR - Miller Industries Inc.
- PATK - Patrick Industries Inc
- MHH - Mastech Digital Inc
- ARLP - Alliance Resource Partners LP
-
2019
- MUSA - Murphy USA Inc
- CNXN - PC Connection Inc
- WGO - Winnebago Industries
- BDL - Flanigan'S Enterprises
- TGT - Target Corp
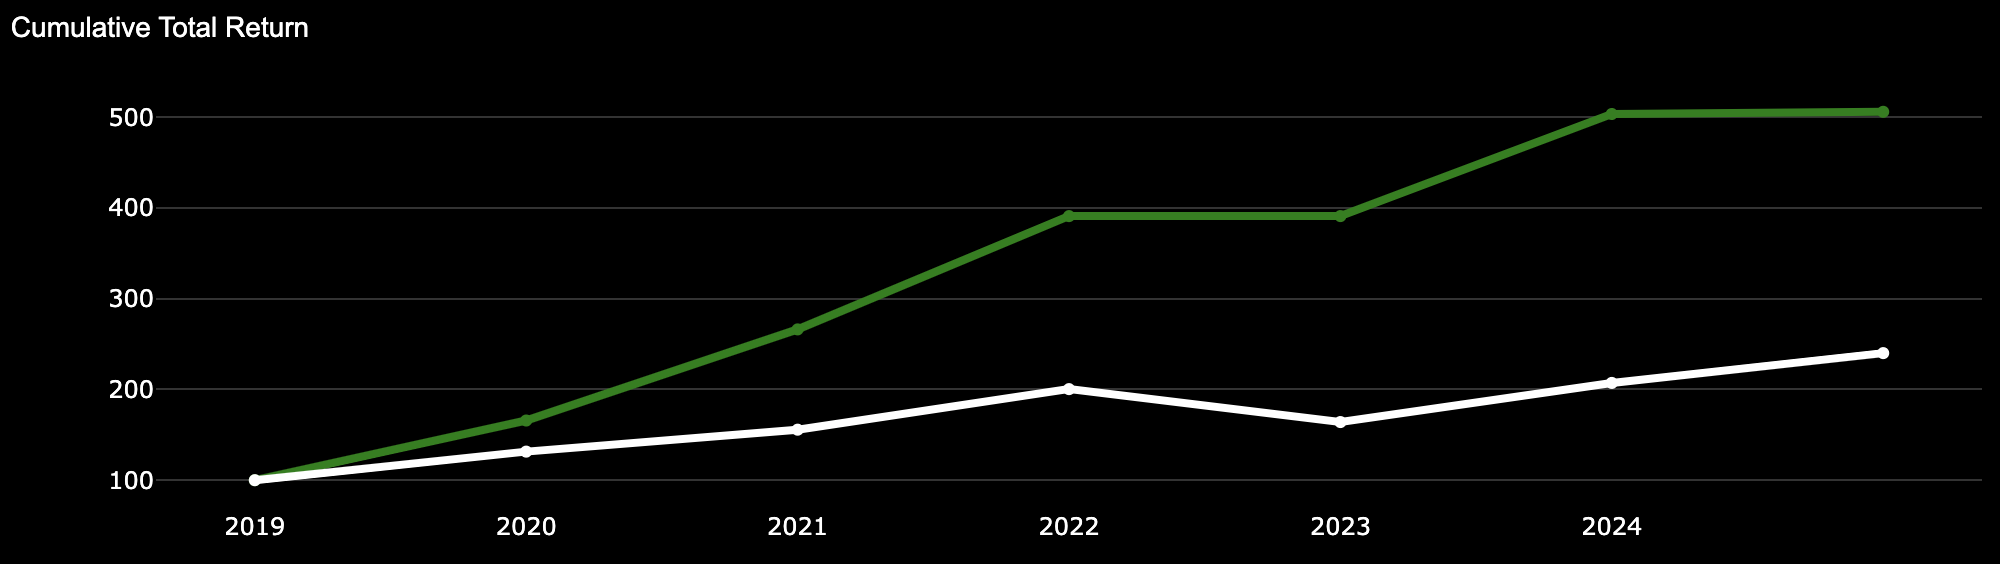
Value Picks Screener Performance
Value Picks Screener Performance
-
Screener Global Performance: 406.06%
Screener CAGR: 34.29%
-
S&P500 Global Performance: 140.06%
S&P 500 CAGR: 15.71%
Value Picks Historical Returns
| Annual Performance | ||||
| Year | SCREENER Gain (%) | S&P 500 Gain (%) | NASDAQ 100 Gain (%) | Dow 30 Gain (%) |
| 2019 | 65.78 | 31.49 | 37.96 | 22.34 |
| 2020 | 60.63 | 18.40 | 47.58 | 7.25 |
| 2021 | 46.88 | 28.71 | 26.63 | 18.73 |
| 2022 | 0.00 | -18.11 | -32.97 | -8.78 |
| 2023 | 28.76 | 26.29 | 53.81 | 13.70 |
| 2024 | 0.48 | 16.32 | 16.98 | 3.79 |
| Overall | 406.06 | 140.06 | 210.95 | 67.69 |