

Titans
Identify financially stable companies with strong long-term performance.
Screener Overview
Screener purpose
The Titans screener is designed to identify companies that demonstrate long-term financial stability and robustness. This screener assists investors in finding businesses with strong profitability, prudent financial management, and a proven track record of performance, ensuring they are well-positioned for enduring success.
The Titans screener meticulously filters stocks based on a comprehensive set of financial criteria, emphasizing return on assets (ROA), return on equity (ROE), and net margins over various time frames. Additionally, it focuses on companies with solid revenue and free cash flow (FCF) growth rates, while ensuring reasonable debt levels and PEG ratios. This screener excludes OTC stocks, preferred stocks, and companies with multiple share classes in one region, as well as those in the energy sector, to maintain a focus on straightforward, high-quality equity investments. Metrics like the Piotroski F-Score further refine the selection process to identify stable, high-quality companies suitable for long-term investment.
Main feature
The standout feature of the Titans screener is its emphasis on long-term financial stability. By focusing on companies with strong ROA, ROE, and net margins, alongside impressive revenue and FCF growth rates, this screener ensures that selected stocks are not only financially robust but also positioned for sustained performance over the long run.
Investment Style
The Titans screener aligns with a "Quality (and Stability) Investing" style. It combines the principles of quality investing, emphasizing financial health and profitability, with a focus on stability to ensure that selected stocks are suitable for long-term investment.
Performance
- Screener - Global Performance: 258.70%
- S&P500 - Global Performance: 140.06%
Screener Attributes
-
Filters
- Positive ROA & ROE.
- Positive ROA % (5y Median)
- Positive ROA % (10y Median)
- ROE % (5y Median) >= 20
- ROE % (10y Median) >= 15
- Piotroski F-Score >= 6
- Debt-to-EBITDA <= 4
- PEG Ratio <= 2
- Gross Margin % & Gross Margin % (10y Median) >= 20
- Net Margin % & Net Margin % (10y Median) >= 4
- 1-Year, 3-Year, 5-Year & 10-Year Revenue Growth Rate (Per Share) >= 0
- 1-Year FCF Growth Rate (Per Share) >= 0
- 3-Year, 5-Year & 10-Year FCF Growth Rate (Per Share) >= 5
- Excludes Energy Sector
-
Backtest Filters
- Ranked by Net Margin
- Max. of 5 stocks selected
- Rebalanced every 2 year
- Equally weighted every 2 year
Screener Selection
-
2024
Log in or Upgrade to access the 2024
stock selection -
2023
- AVGO - Broadcom Inc
- MSFT - Microsoft Corp
- KLAC - KLA Corp
- CSX - CSX Corp
- ASML - ASML Holding NV
-
2022
- Same stock selection as previous year (rebalanced every 2 year)
-
2021
- ADBE - Adobe Inc
- SPGI - S&P Global Inc
- MSFT - Microsoft Corp
- KLAC - KLA Corp
- FIZZ - National Beverage Corp
-
2020
- Same stock selection as previous year (rebalanced every 2 year)
-
2019
- STZ - Constellation Brands Inc
- SEIC - SEI Investments Co
- TXN - Texas Instruments Inc
- FISV - Fiserv Inc
- INFY - Infosys Ltd
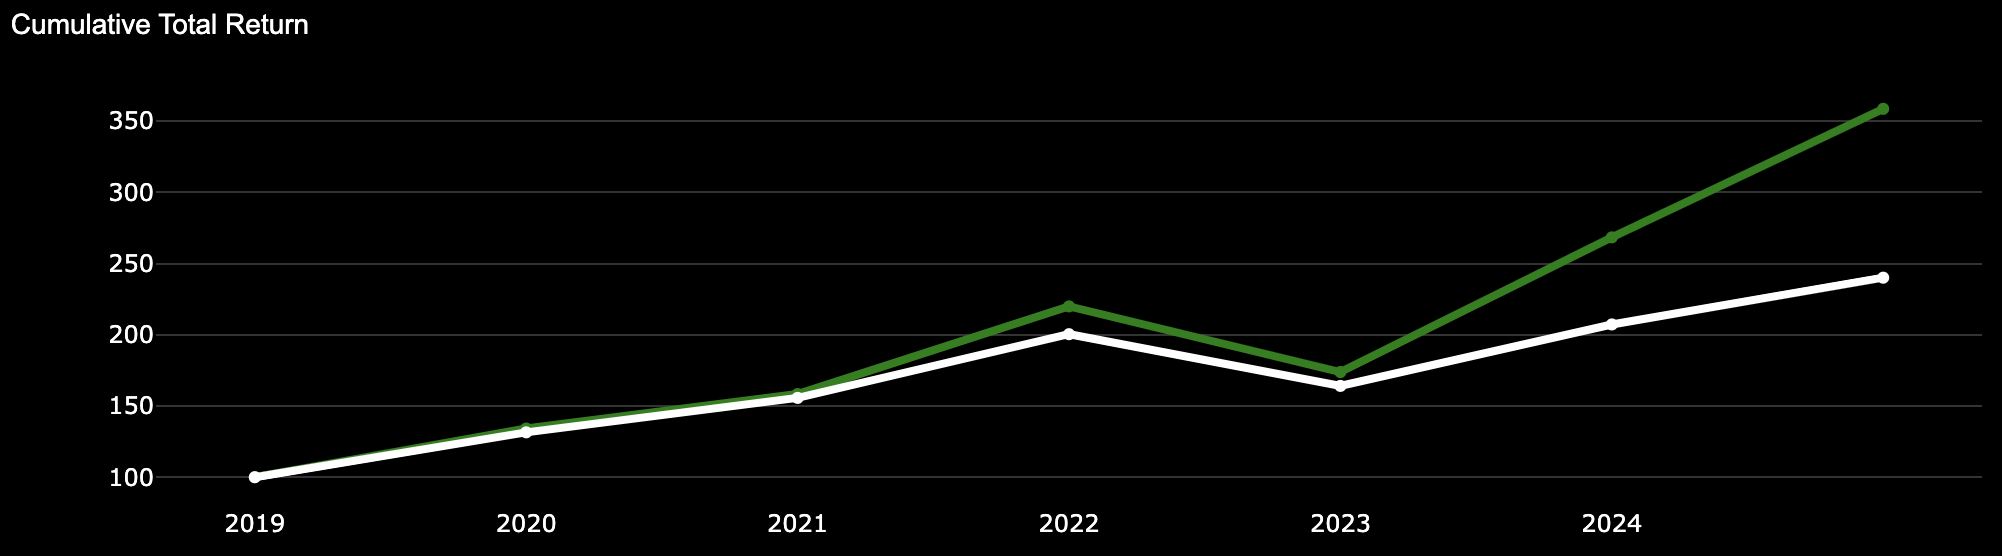
Titans Screener Performance
Titans Screener Performance
-
Screener Global Performance: 258.70%
Screener CAGR: 26.14%
-
S&P500 Global Performance: 140.06%
S&P 500 CAGR: 15.71%
Titans Historical Returns