

Growth Pillars
Financially robust companies with consistent growth metrics.
Screener Overview
Screener purpose
This is our favorite screener at Screening Alpha. The Growth Pillars screener is designed to find companies that maintain strong financial health and demonstrate consistent growth across various financial metrics. This screener assists investors in identifying businesses that are financially robust and show a steady increase in income, cash flow, and revenue over time.
The Growth Pillars screener meticulously filters stocks based on a comprehensive set of financial criteria, emphasizing return on capital (ROC), debt levels, and operating margins. Additionally, it focuses on companies with strong and consistent growth in net income, free cash flow (FCF), and revenue over multiple time frames. This screener excludes OTC stocks, preferred stocks, and companies with multiple share classes in one region to maintain a focus on straightforward, high-quality equity investments. Metrics like gross margin and various growth rates further refine the selection process to identify stable, high-quality growth companies suitable for long-term investment.
Main feature
The standout feature of the Growth Pillars screener is its emphasis on consistent growth and financial stability. By focusing on companies with strong ROC, low debt-to-EBITDA ratios, and robust growth in net income, FCF, and revenue, this screener ensures that selected stocks are not only financially stable but also positioned for sustained growth.
Investment Style
The Growth Pillars screener aligns with a "Growth and Stability Investing" style. It combines the principles of growth investing, emphasizing revenue and cash flow growth, with a focus on stability to ensure that selected stocks are suitable for long-term investment.
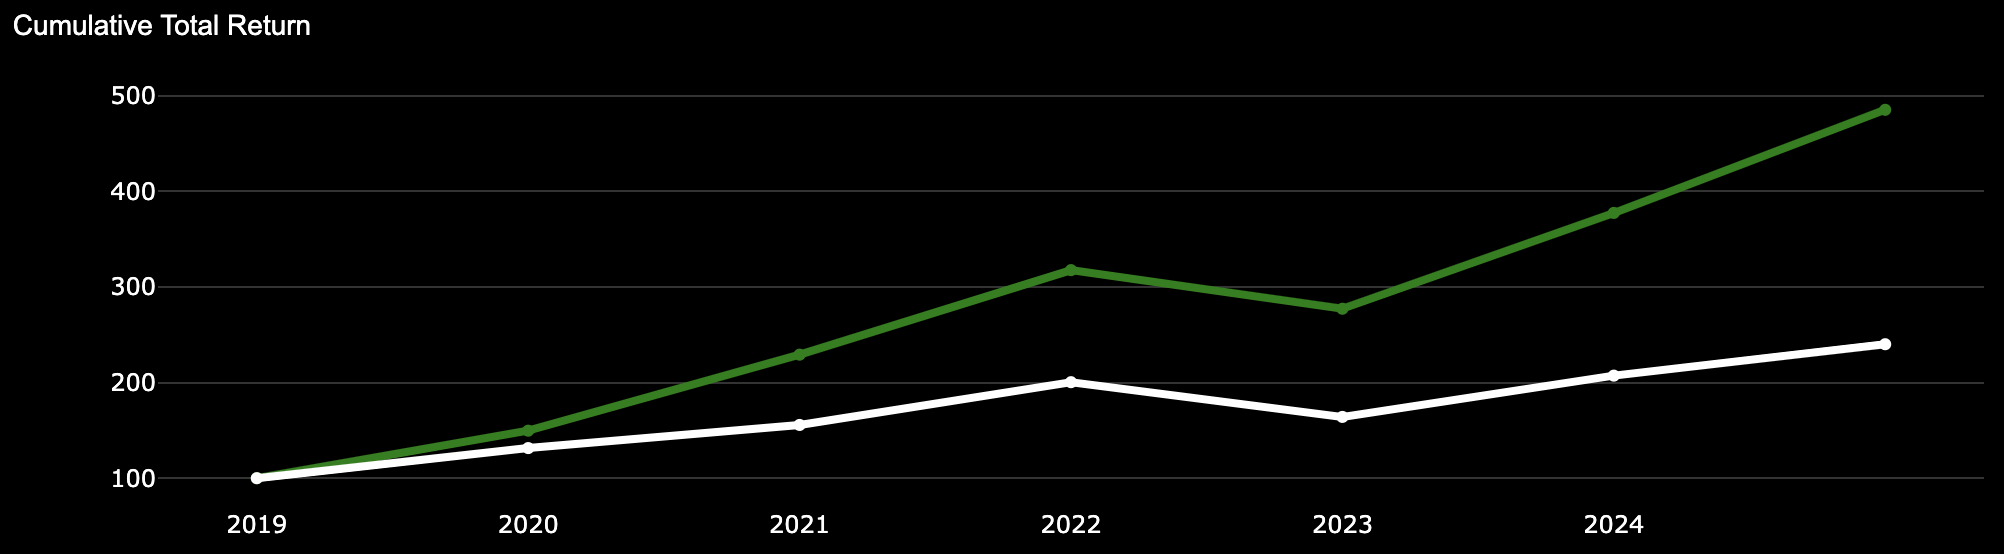
Performance
- Screener - Global Performance: 384.99%
- S&P500 - Global Performance: 140.06%
Screener Attributes
-
Filters
- ROC (10y Median) >= 4
- Debt-to-EBITDA <= 4
- Operating Margin % (10y Median) >= 20
- Positive 1-Year, 3-Year, 5-Year & 10-Year Net Income Growth Rate
- Positive 1-Year, 3-Year, 5-Year & 10-Year FCF Growth Rate (Per Share)
- Positive 1-Year, 3-Year, 5-Year & 10-Year Revenue Growth Rate (Per Share)
- Positive 1-Year, 3-Year, 5-Year & 10-Year Total Revenue Growth Rate
-
Backtest Filters
- Ranked by ROC (10y Median)
- Max. of 10 stocks selected
- Rebalanced every 2 year
- Equally weighted every 2 year
Screener Selection
-
2024
Log in or Upgrade to access the 2024
stock selection -
2023
- TPL - Texas Pacific Land Corp
- MA - Mastercard Inc
- NVO - Novo Nordisk A/S
- NTES - NetEase Inc
- VRSN - VeriSign Inc
- KLAC - KLA Corp
- TSM - Taiwan Semiconductor Manufacturing
- CPRT - Copart Inc
- MSFT - Microsoft Corp
- AMAT - Applied Materials Inc
-
2022
- Same stock selection as previous year (rebalanced every 2 year)
-
2021
- CBOE - Cboe Global Markets
- MKTX - MarketAxess Holdings
- CLCT - Collectors Universe Inc
- MNST - Monster Beverage Corp
- FDS - FactSet Research Systems Inc
- INFY - Infosys Ltd
- KLAC - KLA Corp
- MCO - Moody's Corporation
- AZO - AutoZone Inc
- GOOGL - Alphabet Inc
-
2020
- Same stock selection as previous year (rebalanced every 2 year)
-
2019
- MKTX - MarketAxess Holdings
- INFY - Infosys Ltd
- FDS - FactSet Research Systems Inc
- SLP - Simulations Plus Inc
- SEIC - SEI Investments Co
- AZO - AutoZone Inc
- TSM - Taiwan Semiconductor Manufacturing
- AAPL - Apple Inc
- ADI - Analog Devices Inc
- FAST - Fastenal Co
Growth Pillars Screener Performance
Growth Pillars Screener Performance
-
Screener Global Performance: 384.99%
Screener CAGR: 33.25%
-
S&P500 Global Performance: 140.06%
S&P 500 CAGR: 15.71%
Growth Pillars Historical Returns
| Annual Performance | ||||
| Year | SCREENER Gain (%) | S&P 500 Gain (%) | NASDAQ 100 Gain (%) | Dow 30 Gain (%) |
| 2019 | 49.67 | 31.49 | 37.96 | 22.34 |
| 2020 | 53.16 | 18.40 | 47.58 | 7.25 |
| 2021 | 38.56 | 28.71 | 26.63 | 18.73 |
| 2022 | -12.73 | -18.11 | -32.97 | -8.78 |
| 2023 | 36.10 | 26.29 | 53.81 | 13.70 |
| 2024 | 28.55 | 16.32 | 16.98 | 3.79 |
| Overall | 384.99 | 140.06 | 210.95 | 67.69 |