

Dividend Growers
Companies with strong financials and growing dividends.
Screener Overview
Screener purpose
The Dividend Growers screener is designed to find companies that not only maintain strong financial health but also demonstrate a consistent and growing dividend payout. This screener assists investors in identifying businesses that are financially robust and committed to rewarding shareholders through increasing dividends over time.
The Dividend Growers screener meticulously filters stocks based on a comprehensive set of financial criteria, emphasizing return on equity (ROE), return on invested capital (ROIC), and free cash flow (FCF) growth rates. Additionally, it focuses on companies with strong and growing dividend payouts, ensuring they have not reduced dividends over the past decade. This screener excludes preferred stocks, OTC stocks, and companies with multiple share classes in one region, as well as those in the energy sector, to maintain a focus on straightforward, high-quality equity investments. Metrics like the Piotroski F-Score further refine the selection process to identify stable, high-quality dividend-paying companies suitable for long-term investment.
Main feature
The standout feature of the Dividend Growers screener is its emphasis on dividend growth and sustainability. By focusing on companies with strong ROE, ROIC, and growing free cash flow, alongside increasing dividend payouts, this screener ensures that selected stocks are not only financially robust but also committed to returning value to shareholders through dividends.
Investment Style
The Dividend Growers screener aligns with a "Dividend Growth and Stability Investing" style. It combines the principles of quality investing, emphasizing financial health and profitability, with a focus on stable and growing dividend payouts to ensure that selected stocks are suitable for long-term income-focused investment.
Performance
- Screener - Global Performance: 190.66%
- S&P500 - Global Performance: 140.06%
Screener Attributes
-
Filters
- 3-Year, 5-Year & 10-Year Dividend Growth Rate (Per Share) >= 1%
- Years Of No Dividend Reduction >= 10
- ROE % (10y Median) >= 10
- ROIC (ROIC) (10y Median) >= 10
- Piotroski F-Score >= 8
- ROE % & ROE % (5y Median) >= 5%
- ROIC% & ROIC (5y Median) >= 5%
- 3-Year & 5-Year FCF Growth Rate (Per Share) >= 1%
- 10-Year FCF Growth Rate (Per Share) >= 10%
-
Backtest Filters
- Ranked by Piotroski F-Score
- Max. of 5 stocks selected
- Rebalanced every year
- Equally weighted every year
Screener Selection
-
2024
Log in or Upgrade to access the 2024
stock selection -
2023
- MA - Mastercard Inc
- RHI - Robert Half International Inc
- V - Visa Inc
- WLK - Westlake Corp
-
2022
- CNI - Canadian National Railway Co
- SEIC - SEI Investments Co
- ACN - Accenture PLC
- AIT - Applied Industrial Technologies Inc
- AVGO - Broadcom Inc
-
2021
- AMAT - Applied Materials Inc
- CHE - Chemed Corp
- MCO - Moody's Corporation
- MKC - McCormick & Co Inc
- SPGI - S&P Global Inc
-
2020
- FDS - FactSet Research Systems Inc
- HEI.A - Heico Corp
- ROK - Rockwell Automation Inc
- SYY - Sysco Corp
- V - Visa Inc
-
2019
- BCPC - Balchem Corp
- GWW - W.W. Grainger Inc
- HD - The Home Depot Inc
- IEX - IDEX Corp
- ROST - Ross Stores Inc
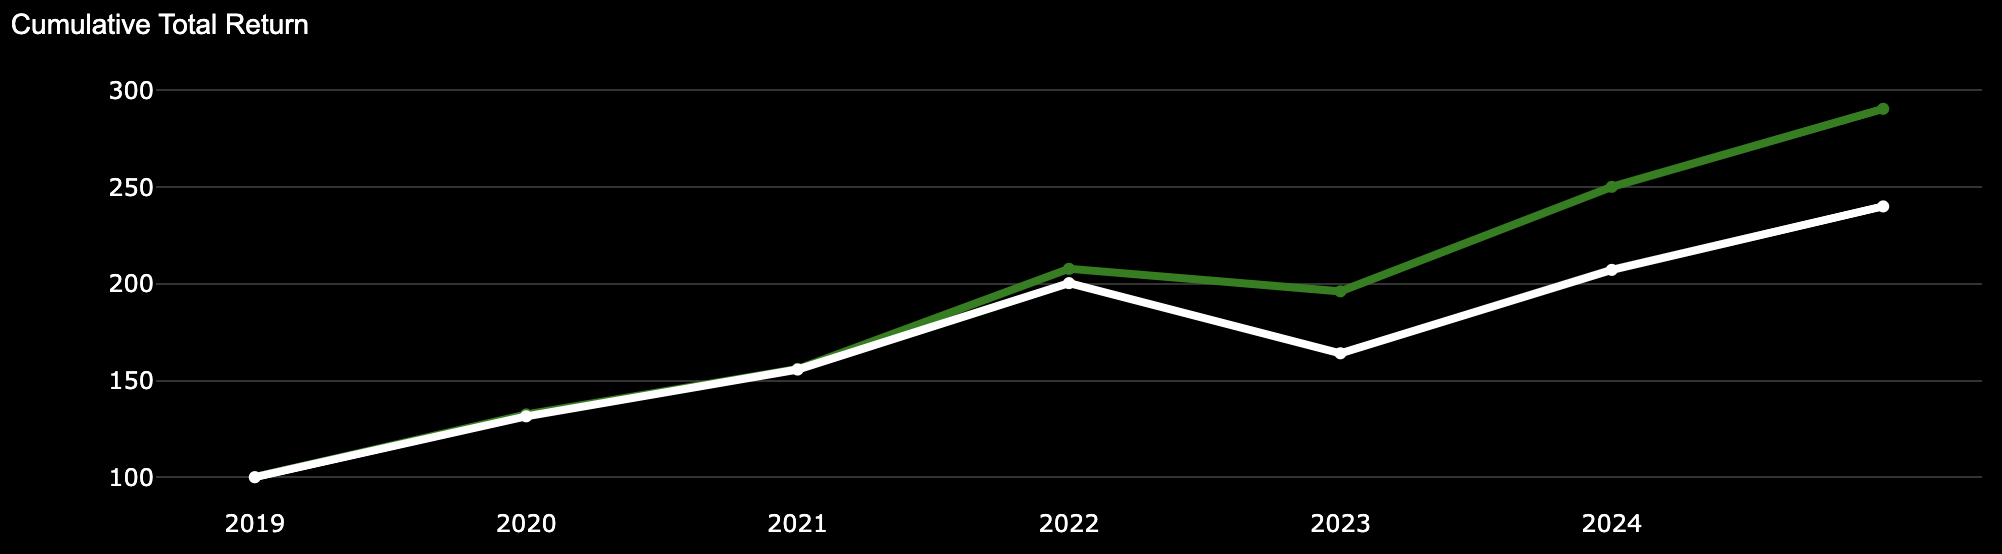
Dividend Growers Screener Performance
Dividend Growers Screener Performance
-
Screener Global Performance: 190.66%
Screener CAGR: 21.41%
-
S&P500 Global Performance: 140.06%
S&P 500 CAGR: 15.71%
Dividend Growers Historical Returns
| Annual Performance | ||||
| Year | SCREENER Gain (%) | S&P 500 Gain (%) | NASDAQ 100 Gain (%) | Dow 30 Gain (%) |
| 2019 | 32.48 | 31.49 | 37.96 | 22.34 |
| 2020 | 17.77 | 18.40 | 47.58 | 7.25 |
| 2021 | 33.21 | 28.71 | 26.63 | 18.73 |
| 2022 | -5.63 | -18.11 | -32.97 | -8.78 |
| 2023 | 27.56 | 26.29 | 53.81 | 13.70 |
| 2024 | 16.18 | 16.32 | 16.98 | 3.79 |
| Overall | 190.66 | 140.06 | 210.95 | 67.69 |