

Cannibals
Companies with an active share buyback programme for at least five years
Screener Overview
Screener purpose
The Cannibals screener is designed to find companies that not only maintain strong financial health but also engage in substantial share buybacks, making it particularly appealing to value-oriented investors. This screener assists investors in identifying businesses that are financially robust and actively reduce their share count, potentially increasing the value of remaining shares.
The Cannibals screener meticulously filters stocks based on a comprehensive set of financial criteria, emphasizing return on equity (ROE), share buyback ratios, and free cash flow (FCF) growth rates. Additionally, it focuses on companies with reasonable PEG ratios and market capitalizations above $100 million, ensuring they are established and financially sound. This screener excludes OTC stocks, preferred stocks, and companies with multiple share classes in one region to maintain a focus on straightforward, high-quality equity investments. Metrics like the Piotroski F-Score further refine the selection process to identify stable, high-quality companies that engage in significant share repurchases.
Main feature
The Cannibals screener emphasis on identifying stocks with a robust history of share buybacks, complemented by stringent financial filters. It prioritizes companies that are returning value to shareholders through share repurchases while ensuring they meet essential financial health metrics.
Investment Style
The Cannibals screener aligns with a "Value and Shareholder Yield Investing" style. It combines the principles of value investing, emphasizing financial health and profitability, with a focus on shareholder yield through significant share buybacks to ensure that selected stocks are suitable for long-term value-oriented investment.
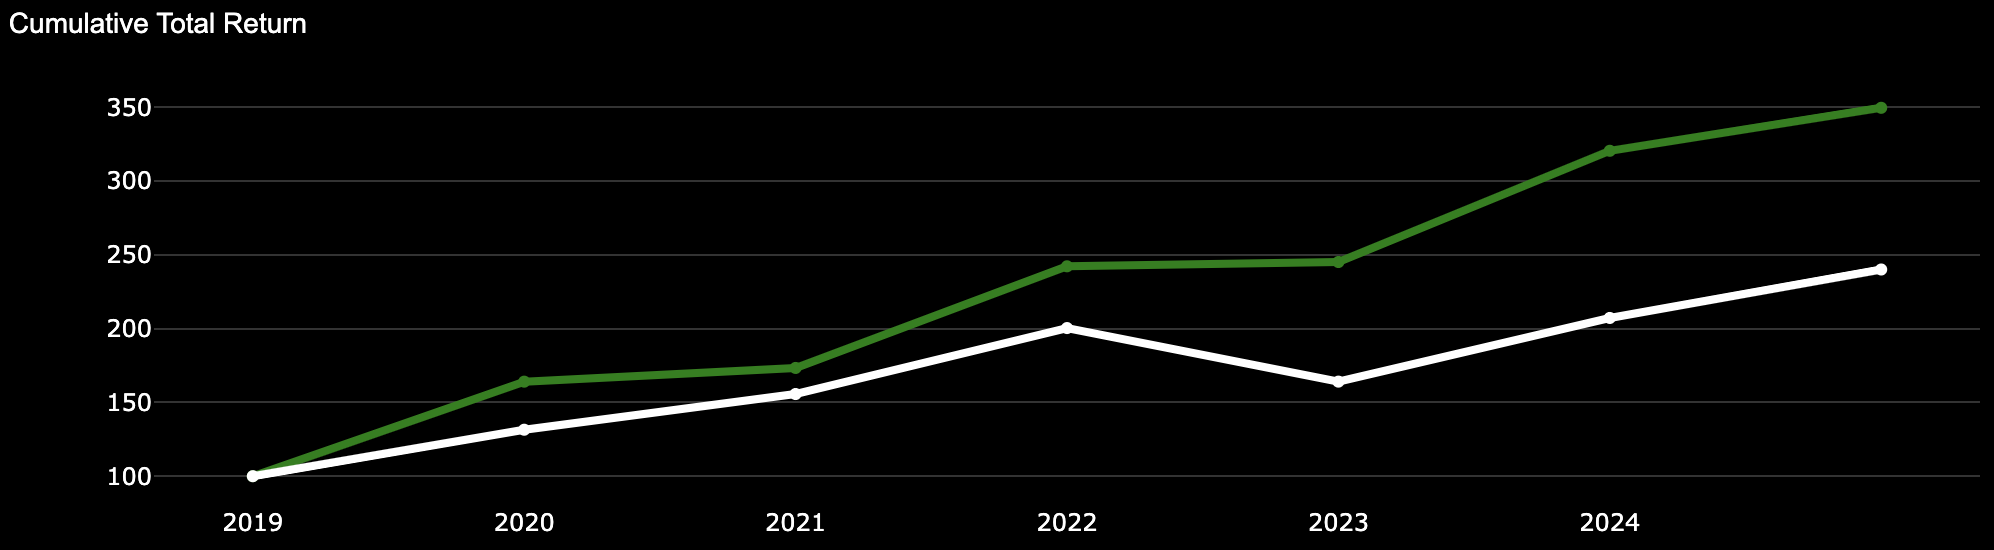
Performance
- Screener - Global Performance: 249.88%
- S&P500 - Global Performance: 140.06%
Screener Attributes
-
Filters
- Market Cap > $100M
- Share Buyback 1-Year Ratio > 5%
- Share Buyback 5-Year Ratio > 5%
- Positive Return On Equity Value
- P/E Growth Ratio < 1
- Free Cash Flow Growth Rate (Per Share) over 1 year > 5%
- Following industries are excluded: Asset Management - Capital Markets - Insurance - Software & REITs
-
Backtest Filters
- Ranked by highest 5-Year Share Buyback Ratio
- Max. of 5 stocks selected
- Rebalanced every 12 month
- Equally weighted every 12 month
Screener Selection
-
2024
Log in or Upgrade to access the 2024
stock selection -
2023
- DVA - DaVita Inc
- VOYA - Voya Financial Inc
- DDS - Dillard's Inc
- ALSN - Allison Transmission Holdings Inc
- SYF - Synchrony Financial
-
2022
- ALSN - Allison Transmission Holdings Inc
- MUSA - Murphy USA Inc
- LPX - Louisiana-Pacific Corp
- PCSB - PCSB Financial Corp
- TOL - Toll Brothers Inc
-
2021
- HESM - Hess Midstream LP
- TOL - Toll Brothers Inc
- BIIB - Biogen Inc
-
2020
- ALSN - Allison Transmission Holdings Inc
- PLCE - Children's Place Inc
- MGA - Magna International Inc
- LEA - Lear Corp
-
2019
- JOE - The St. Joe Co
- MUSA - Murphy USA Inc
- AAPL - Apple Inc
Cannibals Screener Performance
Cannibals Screener Performance
-
Screener Global Performance: 249.88%
Screener CAGR: 25.57%
-
S&P500 Global Performance: 140.06%
S&P 500 CAGR: 15.71%
Cannibals Historical Returns
| Annual Performance | ||||
| Year | SCREENER Gain (%) | S&P 500 Gain (%) | NASDAQ 100 Gain (%) | Dow 30 Gain (%) |
| 2019 | 64.06 | 31.49 | 37.96 | 22.34 |
| 2020 | 5.66 | 18.40 | 47.58 | 7.25 |
| 2021 | 39.75 | 28.71 | 26.63 | 18.73 |
| 2022 | 1.20 | -18.11 | -32.97 | -8.78 |
| 2023 | 30.84 | 26.29 | 53.81 | 13.70 |
| 2024 | 9.08 | 16.32 | 16.98 | 3.79 |
| Overall | 249.88 | 140.06 | 210.95 | 67.69 |